ChooseFI

You're in — welcome to ChooseFI!

Keep an eye on your inbox over the next couple of weeks. We're going to send you the best of what we've built over the last 10 years — curated to help you wherever you are on your financial journey. The more you engage, the better we can tailor what we send to exactly what you need.

Risk Parity Investing Question about this week

L
littleG · · 19 replies

Good morning! I am looking for some help from the Uncle Frank crowd:

I had a strictly stock/bond/cash split until last November when I learned about Risk Parity/Golden Butterfly. Since them, I have started to test the waters, and I have invested in 4 gold funds and cta. Not a huge portion of my net worth yet - maybe $25k between the gold and cta at this point. But my question is this:

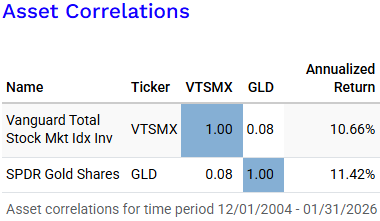
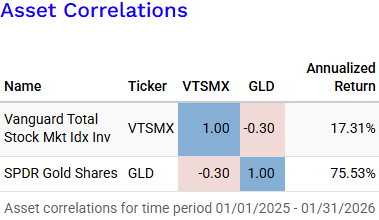
Until yesterday, I have delightfully watched the accounts do what they should - when the market goes down, gold/cta goes up and vice versa. But yesterday there was a market drop, and my gold/cta went down a lot. In fact, only my bonds went up! This was right after I started investing in cta/gold, so I don't understand why risk parity failed me yesterday (or maybe worked because bonds went up?)! Can anyone help explain this to me? I'm new, and I want to understand! Thanks! And yes, I am looking at it every day just cuz that's how I am as I want to understand how it works as I'm tweaking my portfolio!

Share

Replies (19)

Matt Lammer

Matt Lammer

2 months ago

You are not understanding "risk parity". You say you were expecting Gold to go up AS the market went down, which is totally wrong-thinking. That would mean that the 2 assets were strongly (just negatively) correlated. That would be horrible, and not at all what risk parity does. The assets within a risk parity portfolio are selected expressly for their NON-CORRELATION to each other... their completely INDEPENDENT behavior. It's these multiple, overlapping, random behaviors, that 1 or more assets are TYPICALLY doing "well" at any given time, to be tapped for income (or for rebalancing when overweight). And looking at trend lines minute-by-minute or within a day or such is just plain bonkers. ZOOM OUT. The Golden Ratio is awesome (and being FIREd for 5 years and my FI wife FIREing next year, we're effectively 100% Golden Ratio) for a number of reasons, that largely comes down to it having the highest Safe Withdrawal Rate. The blend of funds means, that, where a 100% Equity (Total Stock Market portfolio:

Total Stock Market Portfolio – Portfolio Charts

) can go down up to 50% or be down for over a decade, the Golden Ratio portfolio (

Golden Ratio Portfolio – Portfolio Charts

) is expected to only go down up to 20% and recover within about 3.3 years (take a look at the Performance charts for each, side by side, on a large screen). Yes, there is absolutely still volatility, but it is substantially less, while still growing at a decent clip.

Ian Woodford

Ian Woodford

2 months ago

Good question. Makes me wonder if the correlation formulas smooth themselves, or actually consider daily movement.

Del S

Del S

2 months ago

Can anyone help explain this to me? I'm new, and I want to understand!

Even the most pro of the pros don't understand what moves markets until they see the data and what happens. Treasury auction to satisfy US government debt need changing duration mix and/or undersubscribed? Day of common option contracts expiring and gyrating the amount of money in markets? Obscure political squeeze impacting physical delivery of 1/5 of all the world's supply of a crucial commodity?

Unless you have all the data (and maybe then some) you won't even have a clue as to what underlies price movements. After working at large firms with the best resource and data, I laugh when any talking heads start "explaining" what happened in markets.

As others have said, keep a very broad view, long time horizon, and don't lose your cool. Take the overall principles, and work on identifying what effectively amounts to noise.

BostonFI

BostonFI

2 months ago

Correlations reflect the relative behavior of two assets over a specific period of time. Having a correlation with some other asset very near zero means the asset can move in any direction relative to that other asset. Same direction, opposite direction or flat. So in reality, gold and managed futures did exactly that yesterday. When the market dipped, they shook their magic 8 ball and it said, "outlook not good". On another day under similar conditions, they could go up or hold steady.

Note too that correlations change depending on the time period you look at. Gold (GLD) has a 0.08 correlation (strongly uncorrelated) to the total market (VTSMX) since 12/1/2004. Screen shots from Portfolio Visualizer.

32533721-1692-48dc-a780-d78e8600aa0f.png

If you narrow your view to only since 2025, gold looks mildly negatively correlated (-0.30) to the total market.

f7dbe003-4fc5-4180-ae0b-90902f5ae5af.png

Just like how you want to base your investment choices on as much historical data as you can get and not on recent performance, a correlation over a longer time period is more instructive of how an asset will behave than a correlation over a shorter time period.

brub888

brub888

2 months ago

I am continuously amused by FI folks with short term horizons. Timeframes of a day, week, month or year are subject to more randomness than decades. Drawing conclusions based on shorter term results is just guess work. Take a close look at the S&P 500 results from 1/1/2000 to 1/1/2010 (aka the lost decade). Control what you can control (expenses and diversification) and take the results where the come. You don't say what stage in your journey you are, but please recognize the risk parity portfolio strategy is targeted at decumulation not accumulation. The big picture is to trade off expected higher returns for lower variance while you are decumulating (aka spending down).

JoeQ17

JoeQ17

2 months ago

Look today, stocks up, gold up! Dollar down.

but Monday maybe gold and dollar go the same way. It’s not one for one as there are many factors that go into these markets. All the more to zoom out.

Great that you’re getting into risk parity, after analyzing all that was out there it’s what clearly makes sense.

I highly suggest creating a side brokerage account of $10k and running it as a full test case of your desired portfolio with doing withdrawals (transfer to another account). This helps so much with understanding the dynamics of rebalancing, withdrawals, and how it all works before you need it to. Frank walked through this on a bigger pockets episode.

JoeQ17

JoeQ17

2 months ago

Risk parity didn’t fail, zoom out a little. Markets are imperfect so daily fluctuations won’t match how you expect prices to rise and fall. But over months and years through the different macro environments, asset classes function in typical correlations to one another.

yesterday dollar went up so anything tied to the dollar went down. If you hold long term treasury those went up, so risk parity worked!

rx8800

rx8800

2 months ago

I can’t explain it eloquently, but alternative investments like gold etfs and managed futures have zero to minimal correlation to both stocks and bonds. So sometimes they go up together, sometimes go down together and sometimes move opposite of each other. Time is your friend here. There is a lot of movement in the market lately due to “AI bubble?”, the dollar fluctuating in value, and recessionary risks. Among other things as well. Risk parity portfolios are a long term, stay the course model.

Intermediate and long-term bonds are a part of your diversified portfolio for recessionary insurance, which is why they have held steady this week. People are skittish at the moment.

If you haven’t already, dive into portfoliocharts.com

, portfoliovisualizer.com, and testfol.io You can look at asset classes and sometimes your specific portfolio allocations to see how correlated your portfolio is. The websites have so much info to glean. Have fun!

Jenny

Showing 8 of 19 replies

View all replies on Community

Join the Discussion

Sign up to reply, follow discussions, and connect with the ChooseFI community.

Choose FI has partnered with CardRatings for our coverage of credit card products. Choose FI and CardRatings may earn compensation from card issuers when a customer clicks on a link, when an application is approved, or when an account is opened. Opinions, reviews, analyses & recommendations are the author's alone, and have not been reviewed, endorsed or approved by any of these entities. American Express is a ChooseFI advertiser.

Get Brad's weekly FI strategies — free

Join ChooseFI

Start your financial independence journey

  • Access to the ChooseFI community
  • Exclusive FI resources and tools
  • Weekly actionable insights
or

Already have an account? Log in

Try searching for

⌘K to open anytime

Your FI Journey

1/3

Step 1 of 3

How familiar are you with Financial Independence?