ChooseFI
Federal Tax Visualization

Federal Tax Visualization

Bo
BostonFI · · 3 replies

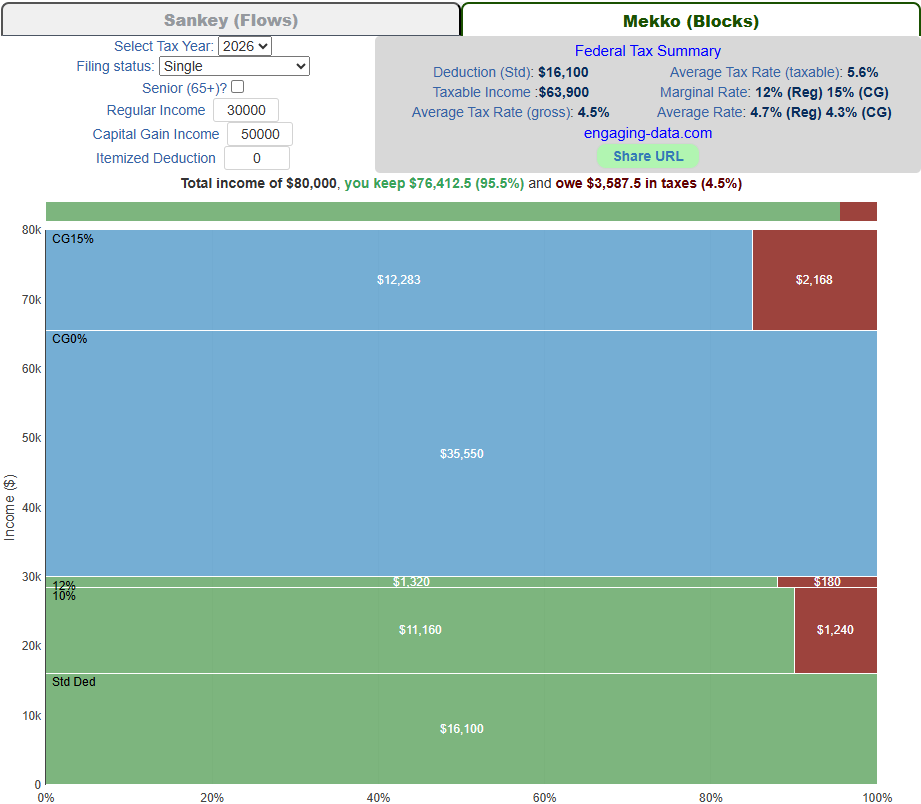
I came across this very neat online tool from engaging-data dot com to visualize Federal taxes owed. As you play with the inputs, you can very easily see the dramatic differences in tax between income from LTCG and qualified dividends (in blue) versus ordinary income and unqualified dividends (in green).

In the snapshot below, a single filer in 2026 has income of $80K yet pays only $3,587 in Federal tax (in red)—a 4.5% effective tax rate.

Share
Share on Facebook
Share on X
Share on Reddit
Share via Email
Copy link

Replies (3)

AnotherMechEngr

AnotherMechEngr

2 months ago

Charlotte

Charlotte

2 months ago

JP_MoreGains

JP_MoreGains

2 months ago

Comments

Your comment will be posted after signing in
Join the Conversation

Create an account or sign in to post a comment.

Username
Email

No password needed. We'll send a verification email.

Email
Password

Find Your FI Number

Calculate how much you need — takes 60 seconds.

Optimize Your FI Timeline

Join ChooseFI

Start your financial independence journey

  • Access to the ChooseFI community
  • Exclusive FI resources and tools
  • Weekly actionable insights
or

No password needed — we'll email you a verification link.

Already have an account?

Don't have an account?

Try searching for

⌘K to open anytime

Your FI Journey

1/3

Step 1 of 3

How familiar are you with Financial Independence?