Login
Financial Independence

Savings rate, FI number, and the path to freedom.

Retirement Strategies

Withdrawal plans, Roth ladders, and early access.

Investing

Index funds, asset allocation, and real estate.

Tax Strategies

Roth conversions, capital gains, and FI tax planning.

Earning More

Career growth, side hustles, and entrepreneurship.

Money Mindset

Beliefs, purpose, and financial psychology.

Health & Fitness

Exercise, nutrition, and mental wellness.

Shots fired ...

Shots fired ...

roberto -
roberto - 3,699 XP · · 50 replies

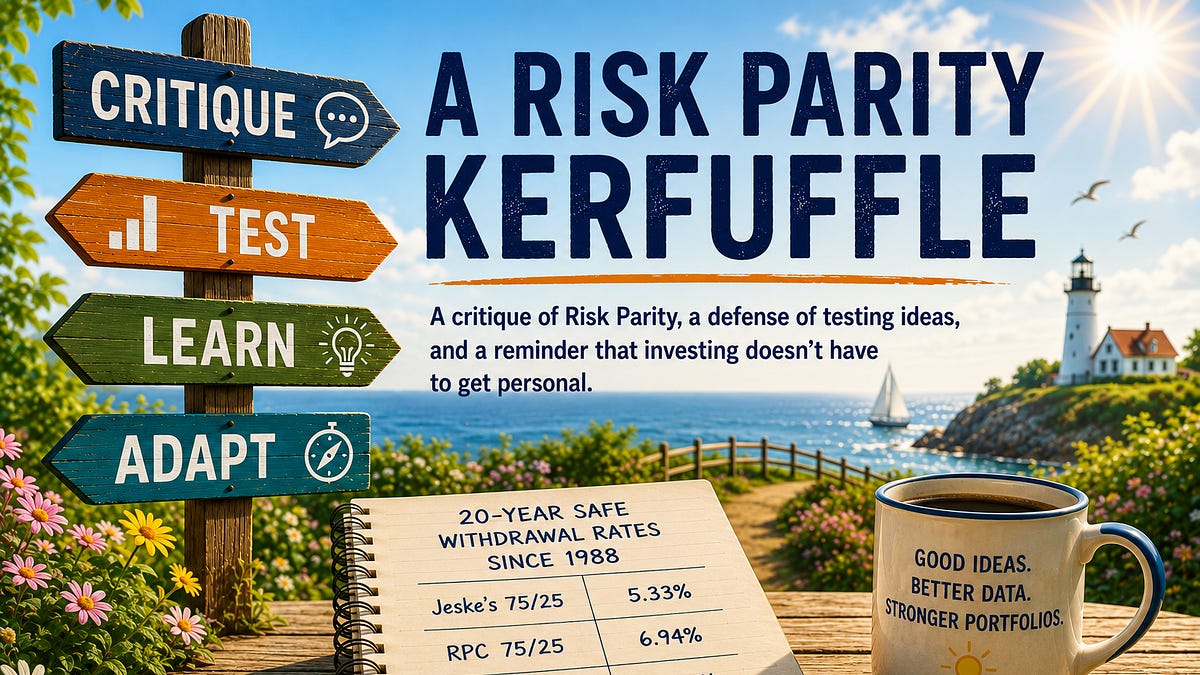
So, today (2026-07-27) Big ERN published a post detailing his analysis of the Risk Parity approach, the latest in his SWR series. (BTW, it really helps make the experience if you imagine Karsten's voice reading aloud as you read the article.)

As is customary for Big ERN, the post is extremely detailed and chock full of data and charts. His conclusion is a bit bearish. As someone who has considered moving in the direction of Risk Parity as I look ahead to the transition from coasting to conventional drawdown, this post makes me think that I might be better served by sticking with a more conventional portfolio allocation. I am curious what those who are already implementing the Risk Parity approach think of Big ERN's analysis and whether it engenders any second thoughts.

Share
Share on Facebook
Share on X
Share on Reddit
Share via Email
Copy link

Replies (50)

jets500

jets500

17 XP

1 month ago

I’ve been going back and forth on this debate for a while now. I definitely come from the Risk Parity crowd, but big ERN is making me reassess my whole retirement allocation plan. It is very unsettling, but probably good in the long run. While I’m disappointed with the unprofessional quips and responses, I love that you have two people who both believe they are right and the other is wrong, and they aren’t just playing nice and building their brand, they’re actually having it out. However I wish that bigger pockets would release the podcast. Right now I’ve decided I have to pick either data going back to 1871 is more informative due to it’s length and presumably different macro environments experienced or the data that begins in 1970 is more relevant because 1970 more accurately effects modern economic times (especially federal reserve manipulating interest rates to boost economy during recessions). I have solace in trusting that the 1971 data is more relevant, but using a risk parity portfolio that maintains 60-75% stocks and sticking to a 4%SWR at least in the beginning as I wait out SORR. Just my take, but I do simultaneously hate and love that ERN made me doubt my plan

Peter Mitchell

Peter Mitchell

300 XP

1 month ago

I don't consider myself knowledgeable enough to have a good opinion on this, but one thing that strikes me is that it seems like both sides rely on history, but both sides choose to pay attention to certain aspects of history. Obviously, I think everyone relies on the history that the economy tends to go UP over long periods of time, but sidelining that for a second, the differences I find are these.

Big ERN:

-CAPE Ratios as a predictor of a healthy/unhealthy market.

-1970s and before data is valuable in comparison to modern economies. In other words 100 years ago economy is a valid comparison to today.

-The SCV performance bump was in the past and won't happen in the future

Risk Parity:

- The entire premise of RP is that different assets in the past have behaved in such a way so as to be useful in a current portfolio. For example, Long term and intermediate term treasury bonds tend to not go down (at least as much) as stocks during a recession. Expand this concepts to multiple assets and you get a risk parity portfolio.

- 1970s and after data is the most valuable in comparison to modern economies (RP tenants would use older data if they had it)

-The SCV performance bump was in the past (and the past 6-7 years or so) and is likely to happen in the future

So no matter what, both investment styles are based on relying on the past to make predictions about the future. The CAPE crystal ball, and the SCV/LCG crystal ball, so to speak.

I'm curious if I'm off base here… but it seems if both sides are relying on the past to make predictions of the future, and that since the future is inherently unknowable–or to put more usefully, nobody knows when an economic downturn will happen and for how long and for how deep.

So… since both sides have assumptions, is it more about whether you agree with the assumptions for a particular methodology or not? It seems like the data can be represented to support either idea.

JDFI

JDFI

4,992 XP

1 month ago

Peter Mitchell@Peter Mitchell , That is very insightful analysis!

But I would add that because most of us are not experts in econometric analysis, it is worth considering the academic and professional expertise of those making the various assumptions you cite above.

On the one hand, we have Karsten Jeske, a PhD economist, former quant for the US Federal Reserve (the preeminent institution for economic quantitative analysis in the US) and instructor of both university undergraduate and PhD level economics courses - eminently qualified to evaluate which assumptions are appropriate for a given type of econometric analysis (e.g. SWR research).

On the other, we have various people with expertise in unrelated areas (lawyer, engineer, and anonymous people on the internet whose expertise is unknown) or less deep but direct finance expertise - such as financial advisors.

I consider it far more prudent to trust the econometric assumptions of the former than the latter, because the expertise is squarely in the area of determing which assumptions are most applicable under the circumstances.

For instance, Karsten says that earlier decades (before 1970) are relevant to today's SWR, because there are many different types of economic conditions that naturally occur (in the past and can occur in the future), and not all of them have occurred since 1970, so if you skip any before 1970, you aren't considering key types of economic conditions that have reasonable odds of occurring again, and because only going back to 1970 provides a data set that is not statistically significant for this analysis, and only provides 5 independent first decades, which is not enough to extrapolate reliably from.

Because we all are not expert quants, we should presumptively defer to quants on which assumptions are most valid, and the bar would be quite high to throw out the assumptions identified by a quant. If another quant/PhD economist disagreed with the assumptions, that would be an assumption to question / explore carefully.

But otherwise, I find it astounding how many people in the FI community seem to believe they are better than a top expert in the field in complex SWR research.

daposton

daposton

210 XP

1 month ago

Has the Bigger Pockets podcast with the Big Ern and Frank come out yet? If so, can you please share the link. Thanks

Rexaroo

Rexaroo

119 XP

1 month ago

Interesting blog post. Appreciate you sharing.

I saw this one was shared as well in the FB group.

mydknyght

mydknyght

161 XP

1 month ago

I know I'm a late-comer to this discussion. I don't have skin in the game. There are more than enough portfolio flavors to fit any preference, mine included. I've used insights from ERN and Risk Parity Radio for my own portfolio construction and I am open to changing my mind when new evidence comes to light. As someone once said, "When the facts change, I change my mind. What do you do, sir?"

On the other hand, I have noticed a tendency for FI proponents of one strategy or another to lob grenades at one another. Most of the time, it is done without naming names, but it is usually obvious who they are criticizing.

Karsten is just the most caustic of the bunch, routinely throwing around words like "lie," "incompetent," "lazy," "scam" to characterize his fellow bloggers and podcast hosts. It is laughable, because two of his targets either run a non-profit (Paul Merriman) or donate all proceeds to charity (Frank Vasquez).

But Frank isn't without guilt here either. I only recently heard him bad mouth TIPS as an investment strategy, saying the only people who every use them have over-saved—this despite a 30-year TIPS ladder currently paying out 4.8% inflation adjusted income per year risk-free! I'm not sure if Frank's criticism was supposed to be a dig at Bill Bernstein or what?

Nonetheless, and quite hilariously, Bill Bernstein wrote an article debunking both mean variance optimization (read: Risk Parity) and Monte Carlo analysis (presumably he would include historical analyses like that of ERN). He doesn't call anyone names, but it is implied that people who who use such things are gullible rubes and that the best thing is a simple TIPS ladder with asset liability matching (the very thing Frank dislikes!).

I sincerely don't get the need for a circular firing squad. Any of these investment strategies will probably be fine and are far and above better than fartcoin + MSTY or whatever the heck retail investors are buying these days. People should go back and read Jim Dahle's 150+ Portfolios Better than Yours for some perspective on why portfolio construction is only one small part of an investment plan. Pick a strategy and get on with the rest of your life.

Wade Pfau is another good resource for perspective on portfolio construction, particularly his RISA framework. As Christine Benz says, "stop bickering" about portfolio construction and retirement income strategies and work on other parts of your plan, most of which have a far greater impact on life satisfaction.

And before anyone quips: Yes, it can be risky for someone to put all their nest egg in one strategy and have it backfire spectacularly. Most people I know, however, would adjust their lifestyle if that came to pass and would survive despite it. Will there be some outliers who live until 101 and run out of money prematurely? Sure, but those are called outliers for a reason and it is why we have things like Social Security and Medicaid.

Everyone should take a deep breath and go touch grass.

Peter Mitchell

Peter Mitchell

300 XP

1 month ago

Absolutely– reading the post and comment section of

makes me feel sick. The level of contempt and personal attacks going on by seeming pillars of the community is distressing.

Whomever thinks this is all just analytical and just the facts (on either side of the debate) is choosing not to see some things.

Del S

Del S

2,337 XP

1 month ago

and Monte Carlo analysis (presumably he would include historical analyses

I was interested in this part, but couldn't find it in the linked article.

Generally, I've seen criticisms of Monte Carlo engines as losing actual linkages between valuations and environments. The logical line many draw from that is to trust historical data more, rather than lumping them in with Monte Carlo.

JoeQ17

JoeQ17

1,527 XP

2 months ago

Roberto Sánchez@Roberto Sánchez check out Risk Parity Chronicles rebuttal to the Big Ern article. Really interested to listen to the upcoming bigger pockets episode with Frank and Big Ern.

BostonFI

BostonFI

5,322 XP

1 month ago

RPC had a great response. Thanks for sharing.

George K

George K

136 XP

2 months ago

I found ERN's post well written and reasoned. I think he nailed the biggest issue with risk parity: assuming that historical relationships will continue into the future. A strategy can look incredibly attractive when you optimize it based on the period you’ve already observed, but that doesn’t necessarily tell us much about how it will behave in a different environment.

The other practical challenge is that many risk parity portfolios have struggled in the last couple of major market downturns. The strategy was built around the idea that bonds would provide diversification when equities fell, but the 2022 inflation shock was a good reminder that the correlations we rely on are not constants. Same thing in 2008. The future can always deliver an environment that looks very different from the historical data.

At the end of the day, I think this is the fundamental challenge in the FIRE community: we’re trying to maximize returns while also building enough safety and resilience that we can actually stick with the plan. Every portfolio choice is a tradeoff. The question isn’t finding the “perfect” portfolio, but deciding where on the efficient frontier we want to live based on our own risk tolerance and circumstances.

That’s why I keep coming back to the simplicity of a total market portfolio. It’s not because it’s guaranteed to be optimal, but because it makes fewer assumptions about the future. The main decision is simply how much risk I’m willing to accept in exchange for expected return.

I hope Frank responds. If I were in his shoes I'd go after ERN and his option trading, which I think belies the rest of his philosophy. It has always felt like “picking up pennies in front of a steamroller” to me!

Matt Lammer

Matt Lammer

671 XP

2 months ago

"Risk parity portfolios have really struggled in the recent downturns"…. Really, says who and compared to what?

Frank's Risk Parity style portfolios performed well within expectations… no one in one should have ever had ANY concern about not getting their expected SWR retirement income from them. It's absurd to think they "failed".

And at the same time, they performed better than ERN'S portfolio?? Which is likewise based on assumptions of past asset performance (and their relationship go one another) perpetuating into the future???

George K

George K

136 XP

2 months ago

To answer your question, I'm talking about 2022 and 2008, the last two big downturns. Risk parity isn't a new idea; Bridgewater's All Weather has been around since the 90s, and the RPAR ETF has been around since 2019.

All Weather lost 20% in 2022, with similar to losses in 2008. RPAR lost ~23% in 2022, worse than the S&P 500's -18% and worse than a plain 60/40 portfolio of -16%.

Like a lot of people, I was initially intrigued by the idea of Risk Parity, but when you look at the performance it is just not there, unless you cherry pick some specific time periods and/or engage in what feels like serious model overfitting to construct some "magic" portfolio ratios.

Matt Lammer

Matt Lammer

671 XP

1 month ago

Again, this isn't any "failure" of such portfolios. Their performance was well within expectations, and, again 2 random cherry picked years means nothing in the grand scheme of things. None of these portfolios were ever designed to not have years of negative returns. They're designed to allow the highest Safe Withdrawal Rates through far worse situations that would destroy someone in 100% Equity or 75-25 portfolio ERN uses (questionably without the ~10% gold allocation his own writings says improves a retirement portfolio…. But nevermind ERN's own research, I guess). Your analysis is faulty. It's based on cherry picking dates and using wrong metrics.

George K

George K

136 XP

1 month ago

Hey Matt, I don't want to get into a full debate about the evidence for and against Risk Parity. ERN already did that, and if his post didn't convince you, nothing I say will either. I was just answering your question directly about when risk parity strategies have underperformed.

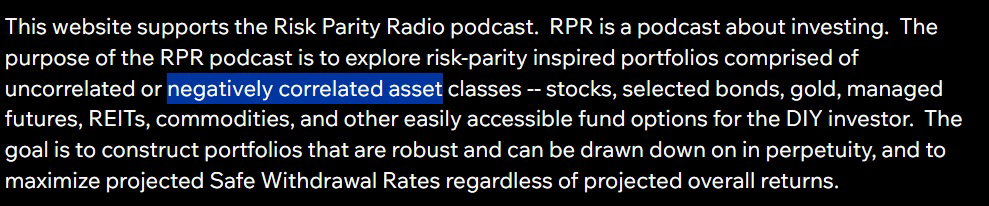
I think the interesting part of the risk parity thesis is that negatively correlated assets are supposed to help when markets drop hard. 2008 and 2022 seem like exactly the environment where that should have shown up, which is why the results stood out to me. Call that cherry picking if you like, but many of us are keen to answer the question: "What happens to my investments in a big downturn?"

Matt Lammer

Matt Lammer

671 XP

1 month ago

Your saying "negatively correlated assets" tracks with common lack of understanding of the fundamentals of such portfolios, which leads to the completely bogus assessment of them. They hold "NON-correlated" (as much as possible) assets. Negative = related oppositely. Non = move unrelated to each other. That's a HUGE difference. As such, in a given year, they're EXPECTED to have the potential drawdown of up to -20%, which is demonstrably less than what a highly correlated portfolio will, more frequently and deeper. "Underperformance" relative to what? A 100% Equity portfolio over the decade of historic overperformance… which even ERN's extensive (going on 10-years) CAPE-centric writings points to high underperformance of Equities ahead (which, by the way, his predictions have yet to materialize, despite his predicting it starting "really soon"/already)?

George K

George K

136 XP

1 month ago

If you're going to take me to school about how risk parity doesn't tout negatively correlated assets, you might want to ask Frank to update his website.

Matt Lammer

Matt Lammer

671 XP

1 month ago

yeah, you missed the vastly more important "uncorrelated" bit just before that.

JayRam

JayRam

296 XP

2 months ago

That doesn't sound like a fair description of risk parity. I think of it as providing exposure to assets beyond stocks and bonds precisely because stocks and bonds are not inversely correlated. At least they are not inversely correlated in all market conditions. These (and most) asset classes hold a stronger correlation to interest rates, although it's a little complicated for bonds depending on duration. So 2022 was nothing new. Stocks and bond both behaved as they should when interest rates increase dramatically. Risk parity (or any diversified portfolio or financial plan) should provide exposure to some uncorrelated assets. Maybe that puts a different color on how to think about it.

MM

MM

253 XP

2 months ago

I disagree I find risk parity to be a gimmick without any real basis on where they came up on allocations. I'm glad Big Ern called it out.

totalkerfuffle

totalkerfuffle

38 XP

2 months ago

Amazing timing but Tyler at PortfolioCharts just released a new tool and article he calls the Global Explorer and one function calculates safe withdrawal rates. It's more granular than his last one. It's such an amazing contrast. His menthodology is so clear and consistent and his dataset is so massive and rich. He's able to replicate the results of Bengen's work and the Cedarburg paper just by including/excluding to match their respective data sets. I hope everyone gives it a read.

JDFI

JDFI

4,992 XP

2 months ago

his dataset is so massive and rich

Thanks for the pointer. I haven't had a chance yet to give it a thorough look, but if I read it correctly, the dataset still only goes back to 1970, whereas most of Karsten's goes back to 1871, and most other SWR datasets go back to 1926.

totalkerfuffle

totalkerfuffle

38 XP

2 months ago

Let me know what you think when you get a chance to read it. In my opinion pre-1970s data isn't very useful because it's basically US large cap blend and intermediate US treasuries. The conclusion I make from that data is that a portfolio of diversified of US stocks and bonds is…fine. But I don't think you can draw much else from it.

JDFI

JDFI

4,992 XP

2 months ago

I finally had a chance to read Tyler's Global Explorer blog post and play around with the tool.

The conclusion I make from that data is that a portfolio of diversified of US stocks and bonds is…fine. But I don't think you can draw much else from it.

I agree with you.

It is a neat tool, and actually could be useful for FIRE retirement planning in different countries with a couple improvements, though, unfortunately, I don't think the data is available for the second one.

The reasons I don't think we in the FIRE community can draw conclusions from this tool are:

  1. The SWR planning horizon is max 30 years.
  2. The dataset only goes back as far as 1970

On point #1: For US only, we know from research by others that US SWR drops ~1/2% (Bengen) to up to 1% (Karsten Jeske aka Big ERN) for FIRE timeframes (40-65 years vs 30), depending on asset allocation. We don't know how or whether that may differ in other countries. Mechanically, it would be easy for Tyler to add Global 40 or 50 year SWR in addition to 30. However, the second issue below (only 56 years of data in the dataset) may preclude that). Ignoring lowering SWR for fire timeframes can increase failure rates by 30% or more - see 'Success Rates for different SWRs, by equity share and retirement horizon (1871-2015)'

On point #2: 1970-mid 2026 is only 56½ years of data in the dataset. That is only 5 full independent first decades of retirement (first decades are generally what determines sequence of returns risk impact, so most critical to have independence). The only Ph.D. economists I'm aware who have weighed in on whether data going back to 1970 is far enough (Karsten Jeske, aka Big ERN, and Wade Pfau) have said it is not, and that it results in overfitting, not statistically significant, and lacks predictive power. Unfortunately, this may not be fixable as longer worldwide datasets may not be available.

Would be a great, practical tool if above two items could be fixed, but it is unlikely that lengthening the datasets to be comparable to other SWR research (back to 1871 or 1926) is feasible.

Roberto Sánchez

Roberto Sánchez

3,412 XP

2 months ago

And it seems that earlier today Karsten released How to “Lie” with Personal Finance – Part 4: Risk Parityh he mentioned in the post from the 27th. However, this is all a lot to digest and I don't currently have the bandwidth to dive deep enough to consume a bunch of dense content from Karsten, Uncle Frank, and Tyler all at once. But I definitely want to dig into this at some point down the line.

AR

AR

77 XP

2 months ago

After his flawed analysis on small cap value using the worst possible funds, I know much better than to waste my time on what he writes. I expect much better from someone with a Ph.D but alas… many Ph.D's are like this.

JDFI

JDFI

4,992 XP

2 months ago

That is a misrepresentation of what Karsten did and why. Karsten selected broad passive/index SCV factor exposure funds.

Whereas those touting ongoing outsized SCV premium (for instance Paul Merriman) selected systematic active SCV funds and specificially looked for the highest performing variant they could find.

That difference is the difference between pure SCV factor premium (what Karsten measured) and conflated SCV factor premium and the effects of active management providing some level of alpha on top of SCV factor premium.

Karsten was transparent that he is measuring pure SCV factor premium.

jane0036

jane0036

282 XP

2 months ago

I'm just not sure why all you risk parity purists are bothering to read Big ERN's article. You clearly don't believe it and aren't going to follow it, so why waste your time?

tinatina

tinatina

100 XP

2 months ago

I did it with a $2,000 test portfolio for a couple months. It aims to have a 6% rate of return, which a 60/40 portfolio does as well. Vasquez says gold is break even over the long term, as are his other balancing assets. When I ran it through FIcalc, it came up with similar returns as a balanced portfolio. I'm still sold on on buying myga annuities (paying 6%) to cover the next 5 years of retirement, with the idea of not replacing when the market is down (which may mean other cash like options once the market returns, as my schedule would be off). We will see if I can stick to it. Not selling corporate stock for 3 years was nerve wracking the last downturn, even though we were still working and not dependenton the money. when the mar

Ava

Ava

234 XP

2 months ago

This thread, funnily enough, reminds me of the conversation from this week's choose fi episode. Particularly how "you can't make a logical objection to an emotional argument". Except in this case, seeing a lot of emotional objections to logical arguments. I find it funny that Karsten is coming to the spreadsheet people (we are spreadsheet people right?) with more and better spreadsheets but criticisms are about his "tone".

JDFI

JDFI

4,992 XP

2 months ago

Ava@Ava you nailed it exactly! Thank you.

People (this is not directed to Ava), before trying to undermine Karsten's arguments (or credibility) by criticizing his tone - if you really think Karsten is wrong, go toe to toe with him on the details of his specific technical arguments.

Take the most objectionable concerns you have with Karsten's technical analysis as detailed in his 2 recent Risk Parity blog posts (or earlier ones) and provide a credible specific, technical counterargument in his own blog comment section on the specific objection.

He is pretty consistent in answering comments, critical or otherwise. Sometimes he agrees, sometimes he pushes back with counter-arguments. Occasionally, he may give an emotionally biased response, but the signal (data-supported logical arguments) to noise (emotional bias) ratio on his blog and comments is very good.

Tricia A

Tricia A

216 XP

2 months ago

Honestly, it just kind of sounds like he's mad about someone suggesting a 5% withdrawal rate. We're following the Golden Ratio in our portfolio now that we're FI, but we're no where near a 5% withdrawal rate. And I don't really understand these simulations that suggest that you will keep putting the pedal to the floor even during a market downturn. I don't judge people who are willing to take that risk, but I wouldn't be comfortable with that type of risk.

JDFI

JDFI

4,992 XP

2 months ago

To me, Karsten doesn't sound mad. He sounds highly motivated to refute what he believes is persistent, serious financial misinformation (~5% SWR being safe as a fixed withdrawal rate under all market conditions).

I don't really understand these simulations that suggest that you will keep putting the pedal to the floor even during a market downturn

The point of these simulations is not that anyone would allow their portfolio to go to zero without scaling back spending if they thought it necessary (and feasible) to avoid running out of money, but rather for people who want to know before retiring what they can safely spend with minimal risk of being forced to cut spending due to poor market conditions.

If that type of information doesn't speak to you, then variable spending / guardrail simulations will be more useful to you. I find fixed SWR simulations quite useful to determine what lifestyle a given nestegg can sustain in the worst case.

Tricia A

Tricia A

216 XP

2 months ago

Thanks for a different perspective. I tried reading it again with that perspective in mind and I still didn't like it. To me, it sounds like he believes he has all the answers and no one should refute him. No matter what his true motivation is, that's how it's coming off with the language he chooses to use and I find it off-putting. I personally enjoy learning about new investment strategies, including SWR, because I don't think that any of it has been 100% dialed in or understood. You don't have to spend much time in here or any other FIRE board to see that I'm in good company as these are always hot topics.

If that type of information doesn't speak to you, then variable spending / guardrail simulations will be more useful to you.

I'm familiar with the guardrails strategy, most notably Aubrey Williams work. He has some great tools on his website that I've played around with in the past and would highly recommend to others.

JDFI

JDFI

4,992 XP

2 months ago

I certainly won't disagree with you that he has the air of a professor lecturing students - probably because he has taught both undergraduate and Ph.D. university courses.

But I would encourage you to evaluate his analysis on its own merits, not based on whether you like his communication style or not, and on his relevant credentialed expertise compared to most social media influencers.

Karsten has a Ph.D. in economics, former Ph.D. and undergraduate economics instructor, former quant for the US Federal Reserve.

Regarding guardrail approaches validated by simulations, the most well know is Guyton-Klinger, though it does seem overly complex. There are several others.

Tricia A

Tricia A

216 XP

2 months ago

But I would encourage you to evaluate his analysis on its own merits, not based on whether you like his communication style

Yep, the analysis is definitely more important than the writing style. Doesn't mean that I can't comment that he sounds mad.

JDFI

JDFI

4,992 XP

2 months ago

Of course.

BostonFI

BostonFI

5,322 XP

2 months ago

I find Karsten's analyses take a lot of time to properly review and vet so I really only skimmed this. What stood out to me was what always stands out to me when Karsten waxes philosophic about risk parity or SCV: he seems to have a grudge he's trying to justify.

He refers to holding a combination of LCG + SCV as stock picking, which is disingenuous. Combining these equity classes is a valid hedge against changing economic conditions like inflation and interest rates, and the combination creates opportunities to take advantage of Shannon's Demon. Karsten writes:

there has been no statistically significant outperformance in SCV in the 1980-2026 return window.

Karsten means outperformance compared to growth stocks. He isn't more specific than "growth" but I'll assume he means LCG and just drop Paul Merriman's B14 data table here as response to this false statement. I can assume from this statement though that when Karsten uses SCV in his analyses, he must be selecting a truly terrible representative fund to stand in for the asset class as a whole and that choice will naturally effect outcomes.

Karsten includes an analysis of what he calls Golden Butterfly "Light" and Golden Ratio "Light" where he removes the offending "stock picking" asset classes (LCG + SCV) and replaces them, presumably with blend funds. What? This is a strawman. He deliberately injects lower-performing LCV and lousy-performing SCG into portfolios that don't suggest holding either of these asset classes. This feels to me like self-indulgence on Karsten's part so can conclude these portfolios are "largely useless".

The rest of the article is similarly littered with choices which IMO discredit his analysis. Karsten puts his thumb on the scale and intentionally handicaps the risk parity portfolios. Tyler from Portfolio Charts wrote an excellent response refuting Karsten's methodology the last time Karsten flamed out over risk parity. Frank also gave a detailed response at that time in RPR episode 447 starting at minute 8:49.

Del S

Del S

2,337 XP

1 month ago

Thank you for providing a very well-written post that advances the discussion. This has probably been one of the most useful I've found in many years that puts together a lot of the discussion that has been going back and forth!

Tricia A

Tricia A

216 XP

2 months ago

This is a terrific response. I think "flaming out" is a perfect way to describe his post.

JDFI

JDFI

4,992 XP

2 months ago

he seems to have a grudge he's trying to justify

I see it quite differently - he appears to be a bit exasperated that he has to keep tamping down new forms of what he believes to be serious SWR misinformation - he once called it "financial malpractice."

He refers to holding a combination of LCG + SCV as stock picking, which is disingenuous.

You are mistaken. The finance world considers factor investing to be a form of stock picking. For example, here Morningstar says:

AQR utilizes one systematic stock-picking model across many of its strategies

Stock picking is a spectrum, from individual stocks to algorithmic criteria.

to this false statement [no statistically significant SCV outperformance since 1980].

There are two problems with your claim that this is false:

  1. Merriman is highly selective in picking the best performing SCV funds he can find, whereas Karsten picks broadly representative SCV funds for analysis, which is more appropriate when making claims about SCV performance in general vs individual fund performance.
  2. You ignored "statistically significant" - which is a well defined term in statistics, and critical in econometric analysis. Karsten went into great detail on the statistical significance analysis in

This is a strawman. He deliberately injects lower-performing LCV and lousy-performing SCG into portfolios that don't suggest holding either of these asset classes

This is a misrepresentation of what he did, maybe because you only skimmed, and as you point out, his analysis is dense and requires a lot of time to review fully.

He is separating out the effects of Risk Parity from the effects of SCV premium, which is a valid question to investigate.

BostonFI

BostonFI

5,322 XP

2 months ago

It sure looks like a grudge to this outside observer. In an addendum to his article Karsten wrote yesterday, he announces an upcoming article which will include a discussion of the Risk Parity Radio portfolios. The title of the article will be, "How To Lie". 🙄 What further point does Karsten still need to make about risk parity that wasn't already made by his July 2026 article or his June 2025 article? Grudge.

Anyway, Tyler from Portfolio Charts already gave a response to Karsten's 2025 article that echoes my own objections to Karsten's methodology.

JDFI

JDFI

4,992 XP

2 months ago

Tyler from Portfolio Charts already gave a response to Karsten's 2025 article that echoes my own objections to Karsten's methodology.

Karsten addressed Tyler's objections in his new Risk Parity post, in the section: "Objections from the Peanut Gallery". And more generally, Karsten has said that Tyler's data is overfitted to too recent 1970+ dataset only.

By the way, Karsten being a Ph.D. economist and former quant for the US Federal Reserve is far more qualified to determine appropriate methodology and data sets for SWR analysis than Tyler, who describes himself as: "a mechanical engineer with a strong math education, a deep interest in finance and investing, and some nifty Excel skills". While Tyler's background is consistent with good mathematical analysis and tools creation (so I'm confident the tools on PortfolioCharts are solid for what they do), he lacks the educational and theoretical depth of Karsten's background and credentials.

BostonFI

BostonFI

5,322 XP

2 months ago

Karsten's impressive CV in economics and monetary policy doesn't mean he's immune to hubris. Every analysis needs to make choices about how to treat historical data and how to model the future, but Karsten's baseline dislike of risk parity and SCV colors his choices. He manipulates the parameters to such a degree that IMO his conclusions are not meaningful. He tosses out historical data if it doesn't align with what he has decided the future will look like, and he uses overly pessimistic forecasting assumptions for assets he disfavors.

Karsten himself concluded in 2020 in part 34 of his SWR series that 10-15% gold improves the SWR of a retirement portfolio. Why has he not incorporated this asset into his recommendations? Why is he still pushing 75/25 six years later?

JDFI

JDFI

4,992 XP

2 months ago

Karsten's impressive CV in economics and monetary policy doesn't mean he's immune to hubris. Every analysis needs to make choices about how to treat historical data and how to model the future

And he explains every single choice specifically and provides his exact reasoning for why he did it and why that is appropriate for the specific analysis question he is answering. I suspect you are skimming over his reasoning too quickly to evaluate whether it is valid or not, and likely applying some confirmation bias because you don't like his conclusions (likely being more critical of anti-RP content than pro-RP content).

His CV is the reason he has the background to know what types of adjustments are required to isolate different effects (considerations that do not come naturally to non-economists), because a lot of the social media financial claims conflate multiple things together that require disentangling to get unambiguous results.

I urge you to slow down on the assumptions of bias on his part and consider his deep expertise in this area gives him a background in knowing when raw economic data doesn't say what it appears to say without adjustments. Each individual adjustment/choice should be evaluated on it's own merits, and unless/until you find specific biased choices, challenge him (in blog comments) specifically on why you believe they are biased or invalid and see how he responds (he responds within a day or two to most comments), everything you're saying here is pure speculation.

Karsten's baseline dislike of risk parity and SCV colors his choices. He manipulates the parameters to such a degree that IMO his conclusions are not meaningful. He tosses out historical data if it doesn't align with what he has decided the future will look like, and he uses overly pessimistic forecasting assumptions for assets he disfavors.

I disagree on all counts. You are entitled to your opinion of course, but everything you said above is only an opinion, and mostly your speculation of Karsten's motivations, rather than his actual demonstrated behaviors.

He is extremely transparent with his assumptions and reasoning for making adjustments to data sets, and he is open to criticism. If he weren't, he wouldn't leave his blog comments section unmoderated, and open indefinitely (all the way back to part 1).

Karsten himself concluded in 2020 in part 34 of his SWR series that 10-15% gold improves the SWR of a retirement portfolio. Why has he not incorporated this asset into his recommendations? Why is he still pushing 75/25 six years later?

He has on a few occasions said you can add 10-15% gold if you like and it may increase SWR. He doesn't hide this conclusion, and sometimes brings it up on his own.

As to why he doesn't change his vanilla retirement portfolio recommendation to be 60% stock/25% bond/15% gold, you could ask him, but his ambivalence may be because gold has such a short market price trading history compared to the other asset classes in his datasets (fixed price, illegal to trade for large periods) that his confidence in that conclusion may be lower than in most of his other research. He has said on occasion that 75% stock / 25% bonds is good enough for most retirees, so it may also be the KISS principle. But again, you could certainly ask him or ask AI - I found it gave a fairly comprehensive answer on Karsten's stated reasoning aggregated from multiple responses he has given.

He recognizes his own biases but follows the data where it leads despite them, as any good researcher would, as evidenced by (from part 34):

with a little bit of confirmation bias, I set out to prove that gold has no place in a retirement portfolio. The average return over time is simply too low. But gold shines (pardon the pun) when all the other asset classes are hurting. And that’s a huge benefit!

UncleFrank

UncleFrank

1,337 XP

2 months ago

Well, I have not read it, but will get to it in due course I am sure.

The real question is going to be whether he is actually relying on his calculator and the data or is just making up assumptions and crystal balls about the future as he often does when he gets back into a corner. (This is why he is at odds with Merriman, Bengen, Tyler at Portfolio Charts and many others who have all taken issue with his "analysis" – he has gone further and further afield with the data manipulation and assumptions as time has gone on.)

I had a lengthy exchange with him back in October 2022 and just searched that set of emails, because we are really beating a dead horse here. I gave him a risk parity style portfolio to run on his calculator back then and here were the results (from him):

"Very impressive performance over the bear markets since 1929. This is over 30 years with capital depletion as the objective.

Even if you switch off the Fama-French factors you still get a SWR of more than 4%."

This is much better than anything he typically uses or recommends, and is based only on a very limited set of assets. So if you believe the data as run by him on his own calculator, the risk parity approach has already won this "debate" four years ago.

Query does he address this conversation or these results from 2022?

The truth is that you can always change assumptions to match pre-made conclusions if you try. That is the stock and trade of the financial services industry, but its a game many can play. I will let others see if they can spot the fallacies first.

daposton

daposton

210 XP

2 months ago

I have read both the ERN articles and I really appreciate all the work and analysis that Karsten put into the 2 posts. The profound take-away I'm struggling with is that he argues that adding anything like TIPS, International Equities, real estate, etc. lowers your failsafe withdrawal rate. From 2000 - 2009, international out performed US equities. Am I misunderstanding the ERN articles? I'm intentionally not mentioning small cap value because he does go into great detail on that asset class.

JDFI

JDFI

4,992 XP

2 months ago

he argues that adding anything like TIPS, International Equities, real estate, etc. lowers your failsafe withdrawal rate. […] Am I misunderstanding the ERN articles?

His above conclusion on real estate was for REITS. He concluded that directly held real estate can increase safe withdrawal rates. See:

for the details. I recommend reading the blog comments also for a more complete picture.

JoeQ17

JoeQ17

1,527 XP

2 months ago

Thanks for sharing. While an advocate for risk parity, I’m always interested to hear different view points. Let me take a look and I’m sure Frank will have some thoughts.

Check out risk parity chronicles for another perspective. The latest article is a great comparison showing the value of diversification. There are others that do a more straight comparison to typical 60/40

Showing 16 of 50 replies

View all replies on Community

Comments

Your comment will be posted after signing in
Join the Conversation

Create an account or sign in to post a comment.

Investing

Investing is the engine that powers your journey to Financial Independence. In this guide, you’ll learn how to build a simple, low-cost portfolio, navigate market volatility, and avoid common pitfalls. Whether you're new to investing or refining your strategy, this resource will help you grow your wealth with confidence.

Investing Guide
How to Invest Money: A Beginner's Guide to FI

Read our complete guide to get up to speed.

From a Recent FI Weekly
“If you’re at Fidelity investing $500/month into a Vanguard mutual fund, you might be losing almost 10% of every contribution before it’s even invested.”

Plus more counterintuitive insights, real stories, and actionable strategies — every Tuesday.

Join 87,000+ people. Free. Unsubscribe anytime.

Your FI Toolkit,
All in One Place

Preview the calculators, trackers, and planning tools that help you see exactly where you are—and what comes next.

Calculate your FI number

Track progress and milestones

Compare paths to FI

or

100% free — no credit card required

Account created! Redirecting...

Try searching for

⌘K to open anytime

Where Are You on the Path to FI?

1/3

Step 1 of 3

Which of these sounds most like you?

Scan to get the app

Point your phone camera at the QR code